
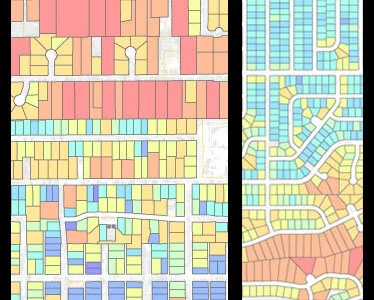
In conjunction with last Fall's debates over the new City of Boulder Compatible Development regulations, the Planning Department posted a lot of information regarding the studies that were done in support of this legislation. One of the most interesting maps made available was a color-coded map of the city based on lot size. The largest lots were red to orange and the smallest blue to purple. What struck me about this map was how the distribution of lot sizes across the city corresponded with the topography of the city. Below is my version of the map, with the predominant high ground or mesas circled. With some exceptions, the largest lots tend to be on the high ground. Anyone who has lived in Boulder for any time would certainly recognize the map as also a fair approximation of house cost as well - larger lots, nicer views = more expensive.

Boulder lot sizes
What I found most interesting are the consequences of topography for the development of single-family houses. The mesas and high ground areas were often the most coveted and were the first to have large private homes built, for the most part individually designed houses. The larger sections of relatively flat land between mesas and sloping down from steeper slopes were more easily subdivided into smaller parcels. Most importantly, these often developer-driven sections of the city were laid out with predominantly north-south running streets as opposed to the east-west streets of the mesas (which are more dictated by the topography). In central and north Boulder these north-south streets were arranged in normative north-south blocks with few houses on the east-west connector streets. In south Boulder, the north-south streets were subdivided into very long blocks.
I think that this development pattern was arrived at fairly innocently, without many of the current regulations as to building coverage, bulk planes, solar shadow regulations and house size in place. However with the increasing overlay of each new regulation, even with a sliding scale of application with regard to lot size, the implications of the initial development pattern, north/south vs. east/west, has lead to a disproportional impact of regulatory restrictions. Of greatest importance is the implications of the overlay of the new Compatible Development bulk plane ordinance with the Solar Shadow regulations on the smaller lots in the areas of the city with the north/south street orientation.
01
A combination of small lot size and shadow casting prohibitions on quite close neighboring properties makes additions to these properties significantly more challenging than other locations throughout the city. That the overlay of multiple city regulations have a greater impact on lower cost properties may be of no surprise to conspiracy theorists, but I do not think that these impacts have been recognized by Planning staff, City Council or the public. I don't want to throw the baby out with the bath water, but some reconsideration of not just the Compatible Development regulations but also the existing Solar Shadow ordinance ought to be undertaken with regard to street orientation. I wouldn't advocate an even more complicated set of rules parsing these properties but some consideration ought to be given to the implications this map reveals.